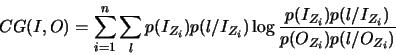
The compound gain (CG) between
a test image ![]() and decoded outcome
and decoded outcome ![]() is a generalization of the Kullback-Leibler joint information gain of
various random variables:
is a generalization of the Kullback-Leibler joint information gain of
various random variables:
Given any coding scheme the CG may then be applied to quantify the
visual distinctness by means of the difference between the original image
![]() and decoded images at various bit rates. It allows us to analyze the
behavior of coders from the viewpoint of the visual distinctness of their
decoded outputs, taking into account that an optimal coder in this
sense tends to produce the lowest value of the CG. The software and documentation
of the compound gain may be accessed in the Internet site with URL of
http://decsai.ugr.es/cvg/CG
or by anonymous ftp to decsai.ugr.es with the path pub/cvg/software
in the compressed tar file cg.tar.gz.
and decoded images at various bit rates. It allows us to analyze the
behavior of coders from the viewpoint of the visual distinctness of their
decoded outputs, taking into account that an optimal coder in this
sense tends to produce the lowest value of the CG. The software and documentation
of the compound gain may be accessed in the Internet site with URL of
http://decsai.ugr.es/cvg/CG
or by anonymous ftp to decsai.ugr.es with the path pub/cvg/software
in the compressed tar file cg.tar.gz.
This first experiment designed to analyze the comparative performance of the PSNR and the CG for predicting visual (subjective) quality of decoded outputs at low bit rates.
Test image ![]() from a dataset of 100 standard
from a dataset of 100 standard ![]() grayscale test images shown in the image
dataset was firstly compressed at 0.0156, 0.0312, 0.0625, and 0.08
bpp using SPIHT,
and RECON. Fig. 1 shows the respective reconstructions.
grayscale test images shown in the image
dataset was firstly compressed at 0.0156, 0.0312, 0.0625, and 0.08
bpp using SPIHT,
and RECON. Fig. 1 shows the respective reconstructions.
![\includegraphics[height=21cm]{fig/Fig4.eps}](paper/lowbitrates/img92.png)
|
Fifteen volunteers, non-experts in image compression, subjectively evaluated
the reconstructed images using an ITU-R Recommendation 500-10![]() . The ITU-R 500-10 recommends to classify the test pictures into five
different quality groups: 5 = excellent, the distortions are imperceptible;
4 = good, the distortions are perceptible, but not annoying; 3 = fair, the
distortions are slightly annoying; 2 = poor, the distortions are annoying;
1 = bad, the distortions are very annoying. The method of assessment was
cyclic in that the assessor was first presented with the original picture,
then with the same picture but decoded at a bit rate. Following this she/he
was asked to vote on the second one, keeping the original in mind. The assessor
was presented with a series of pictures at different bitrates in random
order to be assessed. At the end of the series of sessions, the mean score
for each decoded picture was calculated. Table I summarizes the mean
quality factors for different decoded outputs using the compression methods.
. The ITU-R 500-10 recommends to classify the test pictures into five
different quality groups: 5 = excellent, the distortions are imperceptible;
4 = good, the distortions are perceptible, but not annoying; 3 = fair, the
distortions are slightly annoying; 2 = poor, the distortions are annoying;
1 = bad, the distortions are very annoying. The method of assessment was
cyclic in that the assessor was first presented with the original picture,
then with the same picture but decoded at a bit rate. Following this she/he
was asked to vote on the second one, keeping the original in mind. The assessor
was presented with a series of pictures at different bitrates in random
order to be assessed. At the end of the series of sessions, the mean score
for each decoded picture was calculated. Table I summarizes the mean
quality factors for different decoded outputs using the compression methods.
|
|||||||||||||||||||||
![\includegraphics[height=6cm]{fig/Fig5.eps}](paper/lowbitrates/img96.png)
|
Fig. 2 shows 2D plots on rate-distortion as given by the PSNR and the CG for SPIHT and RECON, at 0.0156, 0.0312, 0.0625, and 0.08 bpp.
As can be seen from these plots, the PSNR predicts that the SPIHT results in a higher image fidelity than RECON which does not appear to correlate with subjective quality estimated by human observers (see Table I). On the contrary, the overall impression is that, as predicted by the CG, RECON results in a higher image fidelity than SPIHT, which correlates with subjective fidelity by humans in Table I. Recall that an optimal coder in the CG sense tends to produce the lowest value of the compound gain error.
In a second experiment, test image ![]() from dataset was compressed at very low
bit rates using SPIHT, and RECON. Fig. 3 shows the respective reconstructions
at 0.0156, 0.0312, 0.0625, and 0.08 bpp. A psychophysical experiment was
also performed and again fifteen volunteers subjectively evaluated the reconstructed
images using the ITU-R Recommendation 500-10. Table II summarizes the
mean quality factors that were provided by this subjective evaluation.
from dataset was compressed at very low
bit rates using SPIHT, and RECON. Fig. 3 shows the respective reconstructions
at 0.0156, 0.0312, 0.0625, and 0.08 bpp. A psychophysical experiment was
also performed and again fifteen volunteers subjectively evaluated the reconstructed
images using the ITU-R Recommendation 500-10. Table II summarizes the
mean quality factors that were provided by this subjective evaluation.
![\includegraphics[height=21cm]{fig/Fig6.eps}](paper/lowbitrates/img97.png)
|
|
|||||||||||||||||||||
![\includegraphics[height=5.5cm]{fig/Fig7.eps}](paper/lowbitrates/img98.png)
|
Fig.4 shows 2D plots on rate-distortion as given by the PSNR and the CG for RECON and SPIHT at 0.08, 0.0625, 0.03125 and 0.015625 bpp. The PSNR predicts that SPIHT results in a higher image fidelity than RECON, which does not appear to correlate with subjective quality estimated by human observers (Table II). On the contrary, as can be seen from Fig. 4, the compound gain predicts that RECON results in a higher image fidelity than SPIHT, which correlates with subjective fidelity by humans given in Table II. Summarizing, it seems that, at very low bit rates, whereas the PSNR gives a poor measure of image quality, the CG is a good predictor of visual fidelity for humans performing subjective comparisons.
Internet site with URL of http://decsai.ugr.es/cvg/CG report more experiments, with similar results, designed to analyze the comparative performance of the PSNR and CG.
![]()